VIGraph
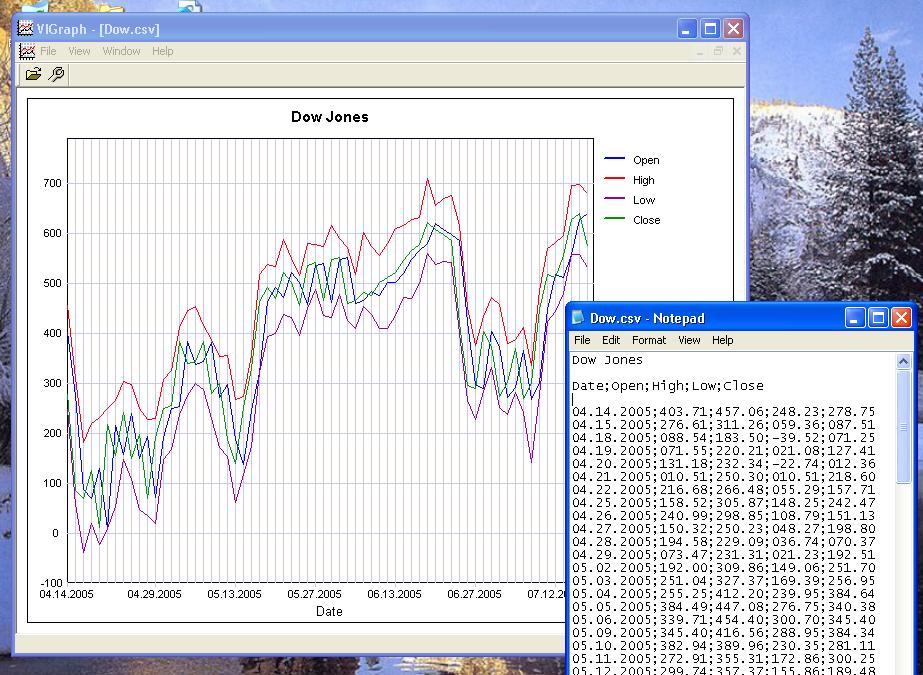
- It draws a diagrams from your txt-data files - It scales your diagrams automatically or manually - You can open as much txt-files as you need simultaneously - Columns in the txt-files can be divided by commas, tabulators or semicolons - You can preview and print out your diagrams - You can show Spectrum for any of your curve (Fast Fourier Transform) - You can get an Interpolation file for all your curves with any intervals
OS:Win7 x32,Win98,WinVista,WinXP
Type:Demo
Price:$17.00
Size:4681 KB
Version:1.5
Tags:GraphDiagramtxtcsvGraphics